
ANNA BAŁAZY1,2, MIKA TOIVOLA1, TIINA REPONEN1, ALBERT PODGÓRSKI2, ANTHONY ZIMMER3 and SERGEY A. GRINSHPUN1
1Department of Environmental Health, Center for Health-Related Aerosol Studies, University of Cincinnati, Cincinnati, OH 45267-0056, USA; 2Department of Chemical and Process Engineering, Warsaw University of Technology, Warsaw, Poland; 3Division of Applied Research and Technology, National Institute for Occupational Safety and Health, Cincinnati, OH 45226, USA
Protection of the human respiratory system from exposure to nanoparticles is becoming an emerging issue in occupational hygiene. The potential adverse health effects associated with particles of 1–100 nm are probably greater than submicron or micron-sized particles. The performance of two models of N95 half-facepiece-filtering respirators against nano-sized parti- cles was evaluated at two inhalation flow rates, 30 and 85 l min-1, following a manikin-based protocol. The aerosol concentration was measured outside and inside the facepiece using the Wide-Range Particle Spectrometer. Sodium chloride particles, conventionally used to certify N-series respirators under NIOSH 42 CFR 84 regulations, were utilized as the challenge aerosol. The targeted particle sizes ranged from 10 to 600 nm, although the standard certification tests are performed with particles of 300 nm, which is assumed to be the most penetrating size. The results indicate that the nanoparticle penetration through a face-sealed N95 respirator may be in excess of the 5% threshold, particularly at high respiratory flow rates. Thus, N95 respirators may not always provide the expected respiratory protection for workers. The highest penetration values representing the poorest respirator protection conditions were observed in the particle diameter range of 30–70 nm. Based on the theoretical simulation, we have concluded that for respirators utilizing mechanical filters, the peak penetration indeed occurs at the particle diameter of 300 nm; however, for pre-charged fiber filters, which are commonly used for N95 respirators, the peak shifts toward nano-sizes. This study has confirmed that the neutralization of particles is a crucial element in evaluating the efficiency of a respirator. The variability of the respirator’s performance was determined for both models and both flow rates. The analysis revealed that the coefficient of variation of the penetration ranged from 0.10 to 0.54 for particles of 20–100 nm in diameter. The fraction of N95 respirators for which the perform- ance test at 85 l min-1 demonstrated excessive (>5%) penetration of nanoparticles was as high as 9/10. The test results obtained in a relatively small (0.096 m3) test chamber and in a large (24.3 m3) walk-in chamber were found essentially the same, thus, suggesting that laboratory-based evalua- tions have a good potential to adequately represent the respirator field performance.
Introduction
Filtering-facepiece respirators are commonly used for personal protection from exposures to respirable aerosol particles. Fine particles are known to cause various respiratory health effects, including allergic alveolitis, asthma, pneumoconioses, cancer and others (WHO, 1999), as well as infectious diseases transmitted by bioaerosol particles, e.g. tuberculosis, Legionnaires’ disease, Q fever, mumps, measles and influenza (McCullough et al., 1997). Nanoparticles are believed to be particularly detrimental to human health since the inflammatory response depends on the surface area of deposited particles rather than their mass (Tran et al., 2000). Other observations reviewed by Churg (2000) indicate that the inflammatory response closely matches the number of ultrafine particles reaching the airways and alveoli. Once deposited into the respiratory tract, nanoparticles can cross the epithelial and endothelial cells into blood and lymph circulation and reach other target sites, such as bone marrow, lymph nodes, spleen and heart. Furthermore, there is increasing evidence that nano- particles, if deposited in the upper airways, can be translocated to the central nervous system and ganglia along axons and dendrites of olfactory neurons (Oberdo¨rster et al., 2005). The N95 half-mask filtering-facepieces are widely used to reduce the inhalation exposure to particles, as these respirators are inexpensive, convenient and highly efficient if properly fitted. They are recommended against solid and liquid aerosols that do not contain oil. The N95 facepieces are certified according to the National Institute for Occupational Safety and Health (NIOSH) regulations, 42 CFR 84 (NIOSH, 1997), after passing the tests performed using charge- neutralized sodium chloride (NaCl) aerosol with the particle size of 300 nm in diameter. The certification criterion for N95 half-facepiece respirators is that the total momentary particle penetration, P, through the respirator cannot exceed 5% at 85 l min-1, i.e. the filtration efficiency, defined as h = 1 P, should be at least 95%. The value of 300 nm is pres- ently accepted as the most penetrating particle size (MPPS) for particulate filters. However, numerous investigations have demonstrated that the MPPS can vary considerably from one filter model to another and is dependent on the operational conditions. For non-charged fibers, while the MPPS increases with increasing fiber diameter (Grafe et al., 2001) and decreasing flow rate (Howard, 2003), it lies primarily within the range of 100– 300 nm. The data collected by Brown (1993) indicate that the MPPS may be even as high as 700 nm for very low (0.001 m s-1) air velocity through the filter. For pre-treated respirator filter media, the MPPS dependence on the fiber charge (Martin and Moyer, 2000) suggests greater uncertainty with respect to the most penetrating aerosol fraction.
To achieve high particle capture efficiency while maintaining relatively low breathing resistance, the N95 respirator filters are typically manufactured with charged (pre-treated) fibers. These are further referred to in this paper as electret filters. The certification tests for N-series filters are carried out until minimum efficiency is achieved or until an aerosol mass of >200 mg has contacted the filter, since, in contrast to mechanical filters, the particle capture efficiency of electret filters decreases initially with the filter loading (Baumgartner and Lo¨ffler, 1987; Martin and Moyer, 2000; Ji et al., 2003). This effect depends on the properties of aerosol particles, and, according to Baumgartner and Lo¨ffler (1987), can be attributed to the neutralization of fiber charges by the charges of opposite polarity that are carried by aerosol particles collected on the fiber. Walsh and Stenhouse (1996) suggested an alternative explanation related to the reduction of electrostatic effect as the layer of particles covering the fiber increases, which, in turn, causes shielding of the electric field. Barrett and Rousseau (1998) attributed the decrease of the electret filter efficiency with loading to the chemical interaction between fibers and aerosol. Once the loading has achieved a certain level, an electret filter begins acting as a mechanical filter and its efficiency increases. The pressure drop across the filter increases during loading. Walsh and Stenhouse (1997) studied how this increase is affected by the particle size, charge and material properties, as well as by the filter face velocity and the fiber charge. They developed the computer simulation of the dendrite formation in two dimensions utilizing the Kuwabara flow field (Kuwabara, 1959). The theoretical study by Walsh and Stenhouse (1997) suggests that the particle deposition on the fiber surface is more uniform when it is primarily driven by the electrostatic mechanism than by inertia. Moreover, they found that more uniform deposition is also associated with an increased fiber charge. Similar results were obtained by Oh et al. (2002) using Brownian dynamics simulation. The Kuwabara flow field was also used by Lathrache et al. (1986b) to calculate the penetration of charged particles through charged fibers. The investigators observed that under the charge equilibrium conditions the particle charge distribution considerably affects the particle deposition onto charged fibers and the dependence of the penetration on the particle size is bimodal. The results of theoretical study by Kanaoka et al. (2001) indicate that charged particles tend to form taller dendrites that concentrate on a more limited area on the fiber surface than uncharged particles. The performance of filtering-facepiece respirators has been extensively tested using non-biological par- ticles (Chen and Willeke, 1992; Qian et al., 1997b, 1998; Barrett and Rousseau, 1998; Huang et al., 1998; Han, 2000; Martin and Moyer, 2000) as well as biological particles (Brosseau et al., 1997; McCullough et al., 1997; Qian et al., 1997a, 1998; Reponen et al., 1999; Wang et al., 1999; Lee et al., 2004a). However, these studies primarily addressed the particle sizes >100 nm. Owing to increasing con- cern about health effects associated with the production of nanomaterials and other issues involving nanoparticles, and because N95-type respirators are widely recommended and used in occupational environments, there is a clear need to evaluate the performance of these respirators in the nano-sized range. Other aspects of testing filtering-facepiece respirators remain unresolved. Although, it seems important to know the variability of the performance characteristics of filtering-facepiece respirators of the same model, we have not found any specific information on this topic in the literature devoted to N95 respirators. Also, while manikin-based protocols have been used for testing of the respirators’ performance in various test chambers (Lee et al., 2004b, 2005), the size of the test chamber needed to accurately predict the field performance of the respirator has not been adequately investigated. In this study, the performance characteristics of N95 respirators operating at different inhalation flow rates were tested at the initial moment of filtration (no loading factor was considered) using nano-sized and submicron NaClparticles(10–600nm). The particle penetration was determined as a function of the particle size. The within-respirator-model variability was also determined. In order to validate the manikin-based testing protocol, similar measurements were conducted in small and large test chambers.
Materials and Methods
Test system
The aerosol particle penetration through the N95 respirator filter was measured following a manikin- based protocol, in which the filtering-facepieces were sealed on the manikin face so that no leakage occurred between the face and the inner filter surfaces. To assure this, the leakage test was conducted using a bubble-producing liquid. The experiments were carried out in a test chamber utilizing sodium chloride aerosol (used by NIOSH in certification testing of N-series filtering-facepieces).
Figure 1 presents a diagram of the experimental set-up for measuring the particle penetration through an N95 respirator. Aspirated by fan (1), the ambient air was purified in the HEPA filter (2) and then supplied to the aerosol generator (3) (a six-jet Collison nebulizer, BGI Inc., Waltham, MA). The generated aerosol was diluted with the clean air supplied by pump (4), passed through dryer (6) and a 85Kr electrical charge equilibrator (7) (Model 3054, TSI Inc., Minneapolis, MN), and directed to the top part of the ‘small’ (0.096 m3) test chamber (8). The design enabled us to achieve a good uniformity of the challenge aerosol in the test chamber. The manikin (9) was placed inside the chamber, and the test respirator (10) was sealed on its face by a silicone sealant. The manikin was equipped with a probe to sample the aerosol inside the facepiece. The outside aerosol was sampled at 5 cm from the respirator outer surface with a probe of approximately the same diameter and length as the in-facepiece sampling probe. The experiments were performed with a manikin at an inhalation air flow provided by a pump (13). The flow rate was controlled by a flow meter (12) (Model 4043, TSI Inc., Minneapolis, MN). In this study, two flow rates were tested: 30 l min-1 representing light workload and 85 l min-1 representing heavy work load (the latter is used in respirator certification tests). The inside and outside aerosol sampling probes operating at 1 l min-1 were connected to the Wide-Range Particle Spectrometer (14) (WPS, model 1000 XP, Configuration A, MSP Corp., Shoreview, MI).
The WPS combines three measurement principles: the differential mobility analyzer (DMA), the con- densation particle counter (CPC) and laser particle spectrometer (LPS). This allows measuring the dia- meter and the number concentration of aerosol particles in a wide size range, namely from 10 to 10 000 nm particle diameter. The DMA and CPC cover the range of 10 to 500 nm in up to 96 channels, whereas the LPS has a measurement capability from 350 to 10 000 nm in 24 channels. In order to remove

the particles larger than 500 nm from the DMA air stream, the instrument is equipped with the single- stage impactor. A built-in aerosol charge equilibrator (210Po radioactive alpha source) imparts the Boltzmann charge distribution on the particles. After passing through the impactor and the charge equilibrator the aerosol enters the DMA where the particles of a narrow electrical mobility are extracted. The DMA operates in two modes: with the DMA voltage stepped (DMS mode) or scanned exponentially (SMS mode). The particles classified by the DMA according to their electrical mobility are subsequently transported to the CPC for counting. The CPC is of the thermal diffusion type, where butanol condenses on the sampled particles, making them grow to a size that is easy to detect with a light scattering detector (MSP, 2004). The aerosol concentration and particle size distributions measured by WPS inside and outside the respirator, respectively, was analyzed by the personal computer (15) and plotted against the particle size, dp, represented by the mobility diameter for particles up to 350 nm and optical diameter in the size range of 350–600 nm.
For the method validation, selected experiments were repeated using a large (24.3 m3), walk-in test chamber that simulates the field conditions in indoor work environments. In this case the manikin was placed in the center of the chamber and the challenge aerosol was evenly distributed in the chamber volume by a centrifugal fan.
Test N95 respirators
Two models of N95 filtering-facepiece respirators, commercially available from different manufacturers (further referred to as A and B) were selected for this study. Both of them consist of the charged fibers (electret media), and they are widely used in occupational environments. Respirator A is characterized by high fit factor value, while Respirator B has considerably lower fit factor (Coffey et al., 2004). Tables 1 and 2 summarize the physical parameters of respirators A and B, determined by the authors of this study (with the exception of the information on the fiber materials that was provided by manufacturers). The thickness of each layer, L, was measured using a vernier caliper. The fiber diameter, df, was determined by analyzing the micrographs obtained under an optical microscope, connected to a digital camera and a personal computer. The surface density, rSF, was obtained by weighing the samples of filters with a known surface area. Using these parameters and the available density of the fiber material, r, the packing density was calculated as:
![]()
After deducting the areas covered by the silicon sealant, the overall surface area was determined for each facepiece. The above area was 0.0110 m2 for Respirator A and 0.0134 m2 for Respirator B. The face air velocities, U0, calculated as the ratio of the volumetric flow to the surface area, were also differ- ent: at Q = 30 l min-1, U0 = 4.5 cm s-1 for Respirator A and 3.7 cm s-1 for Respirator B; at Q = 85 l min-1, U0 = 12.9 and 10.6 cm s-1 for Respirators A and B, respectively.
Penetration
The aerosol penetration through the N95 respirator was determined particle-size-selectively, as a ratio of the aerosol concentrations recorded in each WPS channel inside, cin(dp), and outside, cout(dp), the facepiece:
![]()
The measuring cycle included three samples upstream of the filter, three samples downstream of the filter and then again three samples upstream of the filter (the last allowed us to assure that the aerosol concentration outside the respirator was consistent during each experiment). The fractional penetration,


P(dp), was calculated based on the mean values of the aerosol concentration recorded in specific channels that were reckoned taking into account the second and the third samples of each cycle. The first samples were excluded as they could be contaminated by the aerosol remaining in the tube after prior measurement.
The measurement data were recorded in 48 channels of the DMA and 24 channels of the LPS. However, when the particle count in a channel was <50, the numbers from two or more channels were combined to achieve statistically representative data. The penetration of aerosol particles >600 nm was not calculated, because there were too few of those outside the respirator.
This study was initiated to primarily address the respirator protection against nanoparticles. The test particle size distribution is shown in Fig. 2. The highest aerosol concentration was observed in the particle diameter range of 20–40 nm. Overall, the test particle size range extended to as much as 600 nm, which allowed us to include dp = 300 nm that is currently adopted for the respirator certification.
Data analysis
To determine the within-respirator-model variability of the penetration, 10 identical facepieces of each model were evaluated for both inhalation flow rates tested in this study. The mean value, standard deviation and the coefficient of variation of P(dp) were calculated for each flow rate and each N95 respirator model using the complete data set obtained from ten experiments. The fraction of identical respirators that did not pass the N95 criterion (i.e. those that demonstrated the particle penetration in excess of 5%) was also determined.
To compare the penetration of sodium chloride particles through the N95 respirators obtained in the small and large chambers, the paired t-tests were run using Origin 6.0 (OriginLab Corp.).
Experimental Results and Discussion
The test chamber effect

Similar to other manikin-based laboratory studies of N95 half-facepiece respirators, our tests were con- ducted in a relatively small test chamber (much smaller than a typical setting in which a worker wears the respirator). As part of the method of validation, we examined whether the performance characteristics obtained in this 0.096 m3 test chamber represent those expected in the field. Figure 3 depicts the comparison of the particle penetrations obtained for Respirator A using small and large (24.3 m3) chambers. The comparison was made for both inhalation flow rates used in this study. As it is difficult to achieve sufficiently high aerosol concentration level in a large volume, a greater number of the WPS channels were combined when analyzing the data collected in a large chamber. For consistency, the same channel-combining strategy was applied for the data obtained in the small chamber when applying the statistical testing. The paired t-tests ran for Respirator A revealed P-values of 0.397 and 0.053 for the inhalation flow rates of 30 and 85 l min-1, respectively. This indicates that the respirator efficiency values determined in two test chambers were not significantly different. A similar conclusion was made for Respirator B.
The above finding suggests that the respirator performance tests carried out in a chamber of relatively small volume can be successfully used to predict the respirator performance in a workplace (this conclusion deals with face-sealed respirators and, thus, does not address the particle penetration through the leakage).
Size selective penetration curve and variability of the respirator performance
The within-respirator-model variability of the respiratory protection provided by Respirators A and B


at inhalation flow rates of 30 and 85 l min-1 is demonstrated in Fig. 4. Table 3 presents the values of the coefficient of variation that is defined as the ratio of the standard deviation to the mean and calculated in the particle diameter range of 20–100 nm. For the particles <20 nm and >100 nm, the penetration was close to zero (suggesting the respiratory protection level of almost 100%) so that there was no need to assess the N95 respirator performance variability. It is seen that at Q = 85 l min-1 the mean values of the penetration through Respirator A reached the 5% threshold for nanoparticles of 41 nm. Furthermore, for Respirator B, the mean penetration was >5% for dp = 33–73 nm, although it is expected to be below this level for all respirable particles (as B is an N95- certified respirator). It is acknowledged that N95 facepieces are certified on the basis of the total instantaneous penetration of 300 nm particles, and for this particle size our experiments showed the mean penetration values considerably <5%. How- ever, the data presented in Fig. 4 revealed that the maximum particle penetration through both N95 facepieces tested in this study occurred not at dp = 300 nm but in the nano-sized range (when the particles mobility diameter is between 40 and 50 nm). Table 3 also presents the fraction of identical respirators, among the 10 tested (n = 10), which had the particle penetration in excess of 5% for some particle sizes. It is seen that at 30 l min-1, the particle penetrations through Respirators A and B were always <5% for all measured particle sizes. The increase of the inhalation flow rate to 85 l min1 decreased the protection level provided by both respirators against particles of 20–100 nm. As a result, 6 of the 10 tested A-facepieces and 9 of the 10 tested B-facepieces showed penetration >5%. Further increase of the inhalation flow rate is anticipated to decrease the protection of N95 respirators against nanoparticles to an even greater extent. Although Q = 85 l min-1 is a relatively high breathing flow rate (simulating human breathing at a heavy work load), much higher rates are believed to be achievable in the workplace. Janssen (2003) refers to the suggestion that respirators should be tested at flow rates exceeding 350 l min-1. The concern in this case is potentially excessive penetration of very small particles; thus, the higher penetration would be represented by the particle number rather than by the particulate mass. One could argue that the mass of penetrated nano- particles is not sufficient to cause health problems. However, the health effects associated with nano- particles may not necessarily relate to the particulate mass. Similarly, the effects caused by the human exposure to biological particles, such as viruses and bacteria, often depends on the number of inhaled bioparticles, for some of which the infectious dose is very low (McCullough and Brosseau, 1999).
With respect to the real life situation, the above findings represent the best-case scenario as the tested respirators were sealed to the manikin so that no particles penetrated through the face-seal leakage. The actual respiratory protection level provided by these respirators may be even lower if the respirator does not have a perfect fit. Coffey et al. (2004) evaluated the fitting characteristics of 18 models of N95 half-facepiece respirators and determined the effect of the fit-testing on their protection level. They showed that respirator wearer cannot expect to achieve the desired level of protection without a proper fit-testing. Moreover, the face-seal leakage increases with the filter loading owing to the pressure drop increase. According to Moyer and Bergman (2000), the penetration of NaCl particles through the face-seal leakage of N95 respirators can increase beyond 5% even at a low-level loading. Thus, given that the loading effect and a poor fit may increase the particle penetration above the levels found in this study, we conclude that the N95 respirators may not be efficient in providing the expected respiratory protection for workers exposed to nanoparticles.
Comparison Of The Theoretical Calculations With The Experimental Data
Mathematical model of the particle penetration through an electret filter
In addition to the experimental data reported above, the theoretical calculations of the particle penetration through respirator filters were conducted using the classic theory of depth filtration (Pich, 1966; Lee and Mukund, 2001):
![]()
where Ef is the collection efficiency of a single fiber. Since the N95 respirator facepieces are usually multilayered, the total penetration through the respirator was determined as a product of the penetrations of each layer, calculated from equation (3).
The capture of particles ranging from 10 to 1000 nm by a mechanical fibrous filter is driven primarily by the diffusion and interception mechanisms. Assuming that these mechanisms are independent, the single- fiber collection efficiency can be obtained from the following equation:

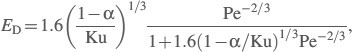
where ED is the single-fiber efficiency due to diffusion and ER is the single-fiber efficiency due to interception. The single-fiber efficiency for the diffusion mechanism can be calculated (Payet et al., 1992; Gougeon et al., 1996) as:
Here Ku is the Kuwabara hydrodynamic factor calculated as
![]()
and Pe is the Peclet number defined as
![]()
where U0 is the face velocity and D is the particle diffusion coefficient
![]()
kB is the Boltzmann constant (1.3807 · 10-23 J K-1), m is the fluid viscosity, T is the fluid absolute temperature, and CC is the Cunningham slip correction factor. The latter is calculated as
![]()
where Kn is the Knudsen number defined as the ratio of the gas free path (that is equal to 65 nm under normal conditions) to the particle radius. The single-fiber efficiency for the interception mechanism was calculated as:
![]()
where NR is the interception parameter defined as the ratio of the particle diameter to the fiber diameter. Figure 5 presents the results of the penetration calculated at U0 = 12.9 cm s-1 (Respirator A at Q = 85 l min-1) for the filter with characteristics, such as L, df, a and rSF, identical to those of Respirator A for two situations: when the fibers were not initially charged (mechanical filter, dotted curve) and when the fibers have a charge density, q, of 13 nC m-1 (electret filters, solid curve). The particle deposition is assumed to be driven by diffusion and interception for mechanical filter, with additional electrostatic interaction for electret. The difference between the two curves is clearly seen. The theory indeed predicts that if the filter fibers of Respirator A were not charged, the MPPS would be 300 nm. In that case, however, the particle penetration peak would reach as high as 80% (which considerably exceeds the experi- mental values). As the commercially available N95 half-facepiece respirators are made of fibrous electret filter media, the electrostatic mechanism plays an important role significantly enhancing the filter cap- turing efficiency. Below we describe the model that was employed to determine the particle penetration curve for the Respirator A with electret filter.
Neutral particles passing through the media made of charged fibers are polarized by the electric field and dipole charges are induced on the particles. The magnitude of the charge is proportional to the particle volume. The theoretical quantification of the par- ticle deposition on charged fibers due to polarization forces is difficult because of uncertainty in the fiber charge density determination. We have failed to find

any specific information about ‘typical’ values of q in the literature with few exceptions. The value of q = 34.2 nC m-1 was referred to by Brown (1979) and later used by Kanaoka et al. (1987) in their calculation of the polarization force. Much lower values, q = 0.5 nC m-1 (Walsh and Stenhouse, 1996) and q = 0.06 nC m-1 (Lathrache et al., 1986b) were predicted theoretically with no experimental confirmation.
To calculate the single-fiber collection efficiency due to polarization force, Kanaoka et al. (1987) used the following semi-empirical equation:
![]()
The parameter NQ0 defined as the ratio of the electrostatic attraction force to the drag force is given for the case of a uniformly (unipolarly) charged fibers by:
![]()
where ep is the relative permittivity of the fiber and e0 is the permittivity of the vacuum. In the present work, the efficiency of collection of neutralized particles on bipolarly charged fibers due to polarization force was calculated from the equation proposed by Lathrache and Fissan (1986a):

In the equation (13) the parameter NQ0 for a line- dipole charged fiber is defined as follows:

where ef is fabric dielectric constant and q denotes the charge of each sign per unit length of the fiber. The empirical constant B is introduced to allow for
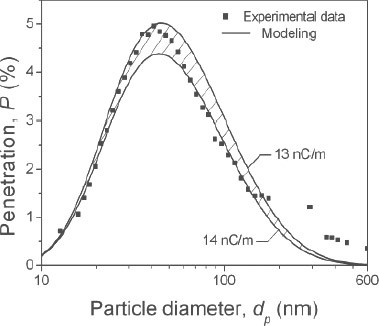
deviation of real filters structure from the ideal geometry of the Kuwabara cell model. At B = 0.21, the theoretical data on the particle penetration through the filter of Respirator A have a best fit with the experimental data. We found that for the above B-value, the single-fiber efficiencies predicted by equations (13) and (11) were not significantly different. The overall collection efficiency of uncharged particles by a single charged fiber can be calculated based on the modified equation (4) as
![]()
As the fiber charge density was not known for Respirator A, we used q = 13 nC m-1 as the best fit for the theoretical and experimental data. Figure 6 depicts the comparison of experimental data and theoretical curves obtained for Respirator A at the flow rate of 85 l min-1 (the shaded area is bracketed by q of 13 and 14 nC m-1). It was assumed that only the middle layer of the respirator is charged since the structures of two other layers indicated that they serve as supported layers rather than highly efficient filters. A slight discrepancy between experiments and theoretical prediction may be caused by several fac- tors. One is non-homogeneity of the respirator fiber structure (Huang et al., 1998). Another is the shad- owing of the fibers that occurs as the downstream fibers are in the shade of upstream ones, which induces collection of fewer particles on the down- stream fibers [this effect is not included in the above theoretical model (Podgo´rski, 2002)]. The third possible reason for the discrepancy is limitations of the model owing to the lack of specific information about the procedure used for the fiber electrization. The theoretical modeling for an electret filter clearly indicates that charging of fibers tremendously decreases the number of particles that penetrate through the filter. For example, at fiber charge density of 13 nC m-1, the polarization force results in the penetration decrease from 80% to 5% for Respirator A. Furthermore, the MPPS shifts towards much smaller particle sizes (40–50 nm) compared with the conventional (mechanical) filter. The pos- sibility of this shift was reported by Martin and Moyer (2000) who investigated the initial penetration of dioctyl phthalate (DOP) aerosol through different models of the particulate respirator filters including N95-type. Based on the experiments with charged and uncharged media, the authors suggested that the maximum penetration of particles through the fiber- charged filters occurs at dp <300 nm (specifically, between 50 and 100 nm).
Although the electret filter looses its initial high efficiency during the aerosol loading, the application of the fiber charging is useful to enhance the filter performance. Other alternatives have limitations. For instance, to achieve the same protection level when using Respirator A with non-charged fibers, one would need to increase the thickness of its middle layer over 20 times or decrease the fiber diameter of this layer 4-fold. The increase of the filter thickness would considerably increase the pressure drop; the decrease of the fiber diameter does not seem to be an easy option either, since production of very fine fibers is technologically challenging.
Neutralization of particles
The certification test of an N95 filtering-facepiece respirator is carried out utilizing charge-neutralized particles in order to examine respirators’ performance under ‘worst-case’ scenario, representing the maximum penetration. Neutralization of aerosol particles is particularly important when testing electret filter.

In case both the fibers and the particles are charged, an emerging Coulombic force significantly enhances the capture of particles and, thus, reduces the penetra- tion. The comparison of penetration values obtained with and without the particle charge equilibrator is shown in Fig. 7. For Respirator A operated at Q = 85 l min-1, the penetration decreased over 3-fold once the 85Kr source was removed.
A similar experiment was conducted for a low efficient mechanical filter, in which case no signifi- cant difference between penetrations of electrically- neutralized and non-neutralized particles was observed. A charged particle polarizes the uncharged fiber and experiences an image force; however, unless the particle carries very high charges, this force is not strong compared with Coulombic or polarization forces.
Our results on the effect of the particle charge on the filter performance are in line with the findings of Chen and Huang (1998) and Fjeld and Owens (1988), who reported that the particle charging decreased the penetration through both the charged and non- charged filters. Kanaoka et al. (1987), who experi- mentally studied the particle collection by an electret filter media with rectangular fibers, achieved the maximum penetration at dp = 30–40 nm for uncharged particles, whereas singly charged particles showed the peak at much larger sizes. These results are fully applicable when attempting to predict the performance of N95 filtering-facepiece respirators against nanoparticles.
Conclusions
The conventional wisdom is that the N95 filtering half-facepiece respirators are highly efficient for protecting the human respiratory tract against fine and ultrafine airborne particles if properly fitted. However, our manikin-based tests revealed that the penetration threshold of 5% established for N95 facepieces could be exceeded when used against nanoparticles in the size range of 30–70 nm. At the same time, the penetration of 300 nm particles (utilized as the most penetrating size for the certification of N95 respirators under 42 CFR 84 NIOSH regulations) was found to be considerably <5% for two N95 respirator models and two inhalation flow rates, 30 and 85 l min-1, tested in this study. The shift of the MPPS towards nano-sized particles is attributed to the electret filter media, which is conven- tionally utilized by the respirator manufacturers nowadays (the application of charged fibers consid- erably increases the filter efficiency, while the breath- ing resistance remains unchanged). The theoretical modeling of the particle penetration through mech- anical and electret filters confirmed the experiment- ally observed shift. The modeling also confirmed that the particles captured by fibers only due to diffusion and interception go through the filter much more readily than those, which—in addition—are subjec- ted to polarization force. It was quantitatively demon- strated that the particle electrical neutralization is a crucial element during testing the electret filters. If not neutralized, the particles can also be attracted to charged fibers owing to Coulombic force that significantly decreases the penetration, thus, resulting in the overestimation of the respirator protection characteristics.
The variability of the respirators’ performance was determined for both N95 models and both inhalation flow rates. The analysis revealed that the coefficient of variation of the penetration ranged from 0.10 to 0.54 for particles of 20–100 nm in diameter. At 85 l min-1, the fraction of N95 respirators for which the performance test demonstrated excessive (>5%) penetration of nanoparticles was as high as 9/10.
The test results obtained in a relatively small (0.096 m3) test chamber and in a large (24.3 m3) walk-in chamber were found essentially the same, suggesting that laboratory-based evaluations have a good potential to adequately represent the respirator field performance.